Business Question
The gender balance in the inflow, mobility, and outflow of employees can shed a light on the diversity and inclusivity of an organization. Therefore, it’s critical for organizations focusing on diversity and inclusion to have insight in the mobility patterns of men and women. Insights into these patterns can help answering the following questions:
- Is the inflow of women sufficient to maintain or increase gender diversity
- Do women have the same opportunities for promotions as men?
- Is there are glass ceiling in the organization?
- Does the organization have more/less trouble retaining women?
- How likely is it that the diversity goals will be met?
Our approach
Using data from the organization’s HR personnel systems, AnalitiQs can create a visualized dashboard for your organization that can answer the aforementioned questions.
Differences between men and women are statistically tested, to uncover which differences are significant and which differences are most likely caused by chance.
Furthermore, predictions are made using predictive analytics to create insights into how the gender balance will look in the future, if the current course is maintained.
In the final product, a powerBI dashboard, the user will receive an overview for the entire organization and the possibility to drill down into specific employee segments. An example could be employees in their thirties, who have been hired in the last three years, and work in a specific functional area such as IT.
Results
Research has shown that diversity combined with an inclusive atmosphere leads to more innovation and productivity, and to lower departure of employees.
Using this dashboard, an organization gains insights in its mobility patterns (inflow, mobility, and outflow of employees) for men and women.
Based on these patterns it’s possible to adjust company policies and to undertake targeted actions in order to increase diversity and inclusion in the organization.
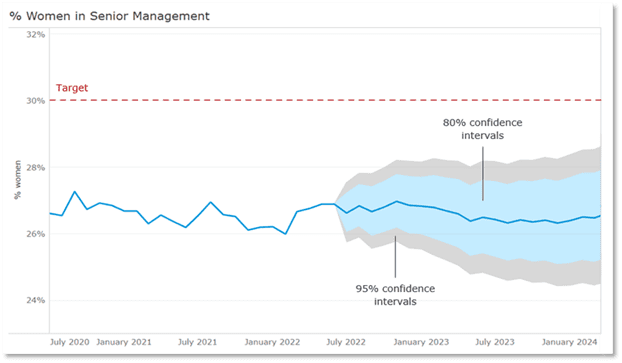
Diversity at the top prediction model
A good male/female reflection at the top of an organization, often says something about the diversity in the rest of the organization. It is also a positive sign to potential employees that men and women have equal opportunities to advance to senior management positions. Many organizations thereby state in their diversity policy that they want to grow towards an equal(er) distribution in top management. In addition, in the Netherlands, but also in many other countries, it is mandatory for listed companies to have at least 30% men and women on their supervisory boards.
Thus, knowing whether enough women are advancing in an organization and whether goals are being met is an important issue. The ‘Diversity at the top’ prediction model of AnalitiQs offers insight into this.
Our approach
Based on data from the HR personnel system AnalitiQs creates a visualized dashboard, where differences between men and women in career opportunities are statistically tested. In this way it becomes clear which differences are significant and which may be coincidental.
Predictive analytics is used to provide insight into what the male/female ratio will look like in the future if the current situation is maintained.
In the final product, a PowerBI dashboard, the user gets an overview for the entire organization and is shown to what extent it is realistic that objectives regarding women in top positions will be achieved.
Interested? Feel free to contact us!

Gido van Puijenbroek
Detailed Service Overview
HR Analysis
Equal Pay
Gender mobility
Absenteeism
Employee Segmentation
Employee Retention & Attrition
Engagement
Impact Measurement / ROI
Learning & Development
Management Development
Onboarding
Organisational Network
Performance
Process Mining
Productivity
Recruitment
Restructuring / Organizational-Development
Reward
Strategic Workforce Planning
Succession Management
Employee Surveys
Culture
Employee Satisfaction
Job Satisfaction
Inclusion
Onboarding
Employee Turnover
Diversity
Employee Community / Panel
Employee Engagement
Employee Commitment
Employee Journey
Employee Net Promotor Score (eNPS)
Employee Value Proposition (EVP)
Employee Enthusiasm
Labour Market
Labour Market Panel
Labour Market Positioning
Leadership
Manager Feedback
Personal Development
Pulse
Retention
Role Clarity
Sentiment
Strategic Alignment
Team Feedback
Total Reward Optimization
Voice of the Employee (VoE)
Work from home
Work Stress
Work Pressure
Capability Building
HR Analytics Strategy
HR Analytics Product Owner
HR Analytics Outsourcing
HR Academy
HR Dashboards
Absenteeism Dashboard
Integral HR Dashboard
Leadership Dashboard
Learning Dashboard
Recruitment Dashboard
Reward Dashboard
Talent Development Dashboard
