Employee Net Promoter Score (eNPS) is a concept that has been used since the 1990s. eNPS provides insight into the extent to which employees recommend an organisation. eNPS is popular because it is easy to measure, calculate and benchmark.
What is eNPS?
The employee Net Promoter Score (eNPS) is a derivative of the Net Promoter Score (NPS). Whereas the Net Promoter Score (NPS) is used to measure the extent to which customers recommend an organisation’s products, making it an indicator of customer loyalty, the Employee Net Promoter Score (eNPS) is used to measure the extent to which employees recommend the organisation itself. This makes the eNPS an indicator of employee engagement.

Benefits of eNPS
Organisations like to use the employee Net Promoter Score (eNPS) because it has four advantages:
- First, it consists of one simple question, making it easy to understand for most employees.
- Secondly, the eNPS is quick, because it only consists of one question and employees do not have to go through an entire set of questions. An additional benefit is that the question is extremely suitable for pulse surveys, which are becoming increasingly popular.
- Furthermore, the eNPS score is quick and easy to calculate, making it an excellent door opener for a dialogue between employees and managers shortly after the survey.
- Fourthly, the method is standardised, which facilitates benchmarking. More about this later.
Calculating the eNPS
The employee Net Promoter Score (eNPS) measures the extent to which employees recommend their employer. The employee Net Promoter Score (eNPS) is based on the Net Promoter Score (NPS) and has a slightly modified recommendation question. The question in the Net Promoter Score (NPS) is: “How likely are you to recommend Company X’s products or services to family, friends and colleagues?”. The employee Net Promoter Score (eNPS) asks: “How likely are you to recommend your organisation as an employer?”.
The participants answer both questions on a scale ranging from 0 to 10. Based on their employee Net Promoter Score (NPS), employees are labelled as either promoters, passives or critics.
- Promoters: employees who are very likely to recommend the organisation. These are the people who will enthusiastically talk about their employer at a party.
- Passives: employees who are likely to recommend the organisation.
- Critics: employees who will not recommend the organisation but will actively express their discontent with the organisation.
Depending on whether the American or European eNPS formula is used, employees are assigned to one of these categories. The European test uses slightly more lenient standards because Europeans are generally less outspoken (see Figure below).
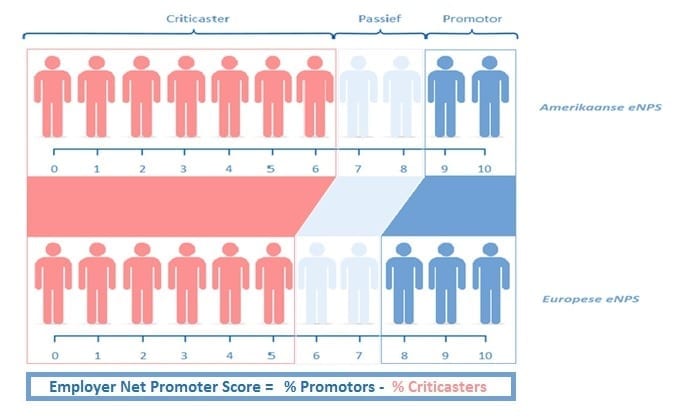
The eNPS score is obtained by subtracting the percentage of critics from the percentage of promoters.
Curious about your organisation’s eNPS? Feel free to contact us.
What is a good eNPS?
eNPS scores can range from -100 to +100. The average eNPS in the Netherlands was 55 in 2021.
This average can serve as a point of reference for what constitutes a ‘good’ eNPS. At the same time, there is no reason to get hung up on averages, given that eNPS scores vary from one sector to another, for example, from one country/continent to another and from one age group to another. eNPS scores are also strongly influenced by internal developments, such as reorganisations.
It is therefore advisable, in any event, to engage in critical introspection before determining a ‘good’ eNPS score. An internal eNPS benchmark is a suitable instrument to this end, in that it answers the question “How are other business units doing?” and sparks a debate about the importance of eNPS for the organisation. After all, a lower eNPS score may be acceptable if employee commitment is seen as less important and vice versa. It is also possible to use an external eNPS benchmark. When doing so, it is vital to choose a benchmark that matches the context of the organisation as closely as possible, so as to ensure that you are still comparing apples to apples.
The eNPS Benchmark
eNPS scores range from -100 to +100. The average eNPS in the Netherlands was 55 in 2021.
AnalitiQs carries out an annual eNPS measurement among its own labour-market panel, which is representative for the workforce in the Netherlands. Using this eNPS as a benchmark, AnalitiQs provides insight into eNPS developments across various sectors, but also, for example, age groups or generations. AnalitiQs’ clients can use this as a yardstick to benchmark themselves against any sector in the Netherlands.
Curious to find out all about eNPS in the Netherlands at a glance? Leave your details in the form to your right, and you will receive our infographic by e-mail immediately. Are you interested in our full ‘eNPS Netherlands’ research report, or would you like to discuss the use of eNPS in your organisation? Feel free to get in touch with us!
ContacteNPS infographic (dutch)
Improving the eNPS
An eNPS score mainly says something about the level of employee engagement; it says nothing about why employees are engaged or not.
To improve the eNPS, however, it is crucial to gain insight into the ‘why’. Thus, it is interesting, after posing the eNPS question, to ask respondents why they gave a certain score or how they view certain aspects of their job, for example how they assess their manager, their workload, personal development opportunities, etc.
Based on the eNPS explanatory notes, text analysis and statistical analysis can be used to map which themes are important to employees and which of these themes should receive priority.
In addition to carrying out an analysis at organisation or business-unit level, it is also important to engage in an active dialogue about the eNPS score at team level, i.e. between employees and managers. After all, different teams may face different issues. It is also important to assure employees that eNPS measurement is not an empty shell, but that the organisation as a whole, from top to bottom, is devoted to optimising employee engagement.
Looking to measure the eNPS in your organisation?
AnalitiQs conducts employee research for leading organisations at home and abroad. eNPS is one of the concepts that we measure. Are you looking to measure the eNPS in your organisation? Feel free to contact us.
Curious about our other employee-related research topics? Click below to see a full overview of our services.
Detailed Service Overview
HR Analysis
Equal Pay
Gender mobility
Absenteeism
Employee Segmentation
Employee Retention & Attrition
Engagement
Impact Measurement / ROI
Learning & Development
Management Development
Onboarding
Organisational Network
Performance
Process Mining
Productivity
Recruitment
Restructuring / Organizational-Development
Reward
Strategic Workforce Planning
Succession Management
Employee Surveys
Culture
Employee Satisfaction
Job Satisfaction
Inclusion
Onboarding
Employee Turnover
Diversity
Employee Community / Panel
Employee Engagement
Employee Commitment
Employee Journey
Employee Net Promotor Score (eNPS)
Employee Value Proposition (EVP)
Employee Enthusiasm
Labour Market
Labour Market Panel
Labour Market Positioning
Leadership
Manager Feedback
Personal Development
Pulse
Retention
Role Clarity
Sentiment
Strategic Alignment
Team Feedback
Total Reward Optimization
Voice of the Employee (VoE)
Work from home
Work Stress
Work Pressure
Capability Building
HR Analytics Strategy
HR Analytics Product Owner
HR Analytics Outsourcing
HR Academy
HR Dashboards
Absenteeism Dashboard
Integral HR Dashboard
Leadership Dashboard
Learning Dashboard
Recruitment Dashboard
Reward Dashboard
Talent Development Dashboard
