Average absenteeism in the Netherlands is on the rise, peaking at above 4% per quarter since 2018, with considerable outliers per sector. Many organisations see this trend as a major challenge and are working hard to reduce absenteeism. Absenteeism appears to be a formidable opponent, however, that still defeats many organisations using a conventional approach.

AnalitiQs helps organisations to develop a different view of absenteeism, based on (absenteeism) data, and to combat absenteeism in a targeted manner. Relevant questions include: “What are the bottlenecks?”; “What are the root causes of absenteeism?”; “What are realistic target standards?”; “How much absenteeism should we anticipate on?”; “How can we optimally deploy absenteeism professionals?”; and “Which interventions are effective?”.
What are examples of absenteeism analysis?
There is no such thing as one absenteeism analysis for all. There are numerous ways to reduce absenteeism through the use of data. Which analysis suits you depends on the context in which your organisation operates. A good absenteeism analysis usually answers the following questions:
Future absenteeism
What will be the future absenteeism rate?
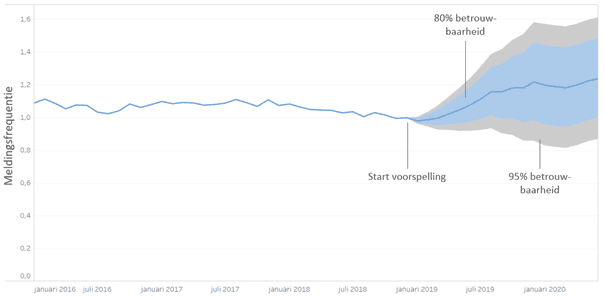
Future absenteeism can be predicted based on historical data. In the above case, the predictive model focuses on reporting frequency, but predictive models can also be based on other absenteeism metrics, such as absenteeism percentages or long-term absenteeism.
Risk groups
Which groups are at risk? In other words, which employee segments must be reached in order to reduce absenteeism?
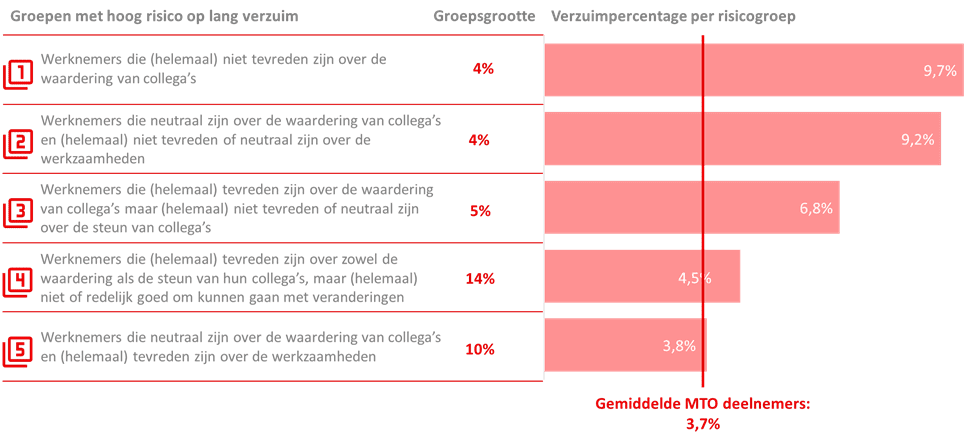
To effectively reduce absenteeism, it is important to know which groups of employees are most at risk. The idea is not to ‘punish’ these employees, but rather to decide, for example, which communication channels or role models to deploy to effectively reach these groups.
Explanatory factors
What are the explanatory factors, and which of these are the key factors to influence in order to effectively reduce absenteeism?
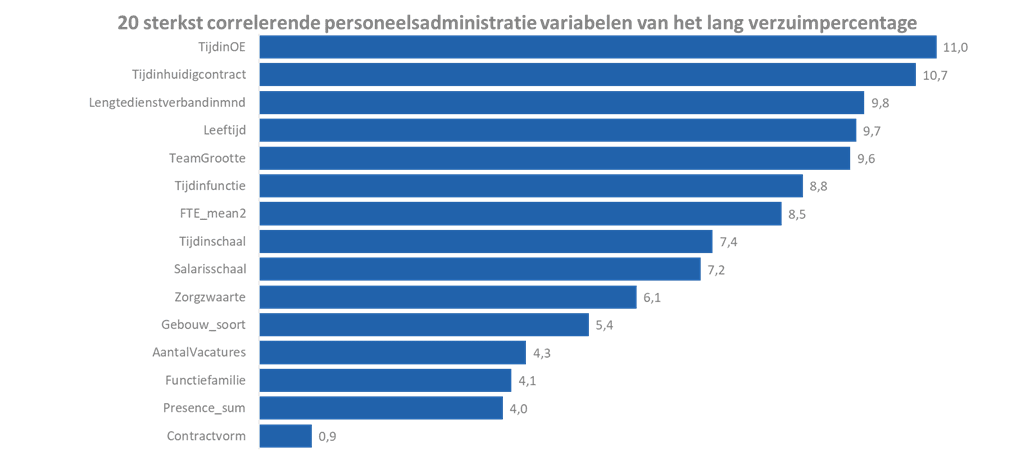
It is of the utmost importance to unambiguously determine the factors that cause absenteeism. Doing so helps in designing action plans and policies that address the key causes of absenteeism. To achieve this, it is important to know which variables correlate with absenteeism and to what extent one variable exhibits a stronger relationship than the other. While this impossible to do using conventional absenteeism reports or simple correlation tests, it can be done through machine learning techniques in combination with a causality exercise.
Optimisation
How can the agenda of the case managers and/or company doctor be optimised, so that people who are the most at risk of long-term absenteeism receive optimal support?
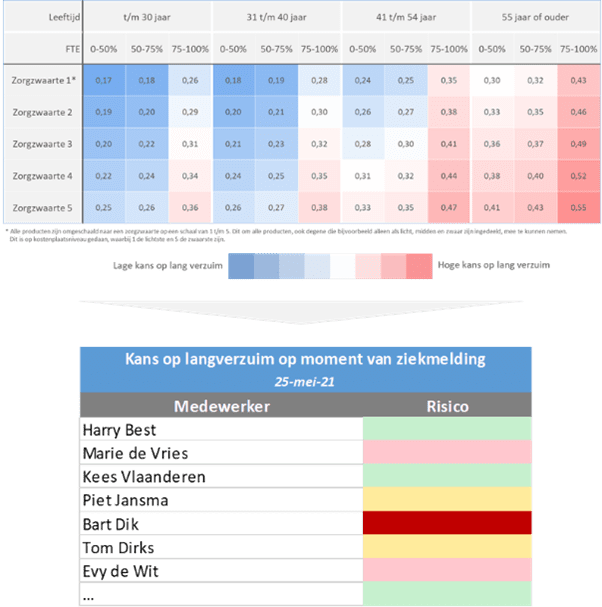
Case managers and company doctors often have busy schedules. This means that, in many organisations, some time will pass before an employee who has reported sick receives counselling. The risk of long-term absenteeism can be calculated per sick report. This insight helps case managers and company doctors to devote their scarce time to those who would benefit the most from a rapid intervention.
A realistic absenteeism standard
What is a realistic absenteeism standard for managers to apply, taking into account the composition of their team, among other factors?
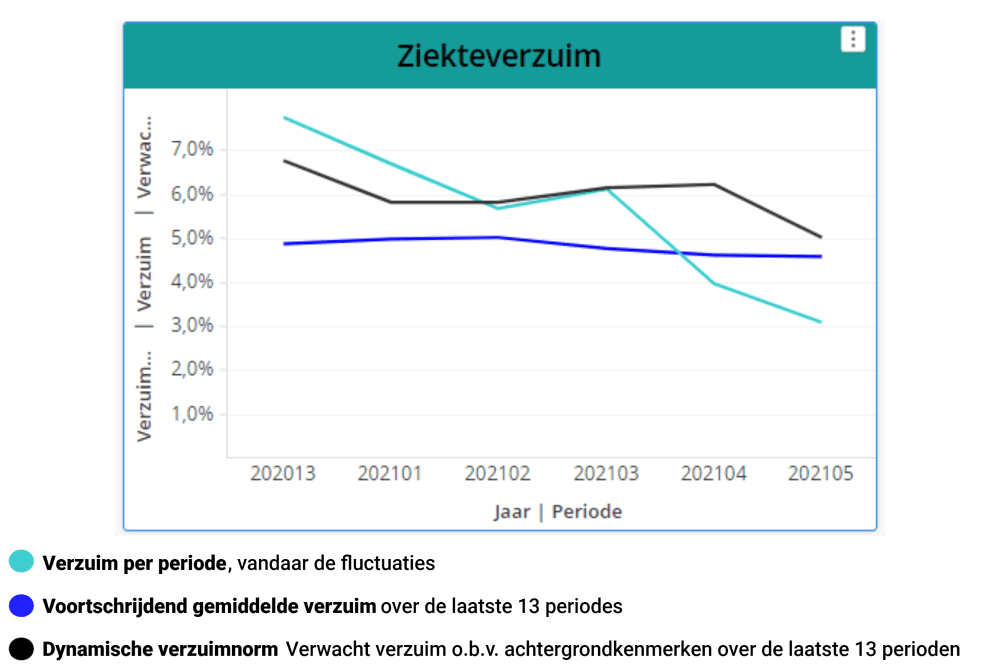
If the moving average of a particular selection is below the dynamic norm, it is safe to assume that this team or cluster is doing better than expected in terms of absenteeism, given its composition and compared to the organisation’s historical records. Of course, the reverse is also true.
Optimal absenteeism process
Is the absenteeism process optimally structured and monitored?
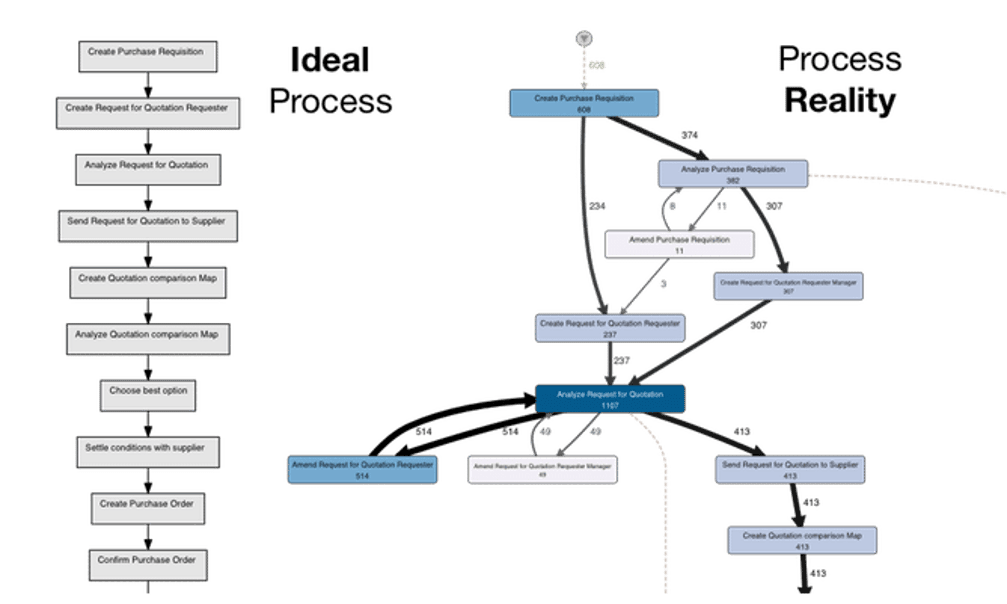
A comparison between the ideal process and process reality reveals opportunities to work more efficiently. In some cases, process mining will yield insights that can be used to further optimise the ideal process. In other cases, insights will show that process actors require more guidance towards the ideal process in order to optimally reduce absenteeism.
Impact of the interventions to reduce absenteeism
What is the effect of the interventions to reduce absenteeism? Are they reaching the right people and do they actually lead to lower absenteeism rates?
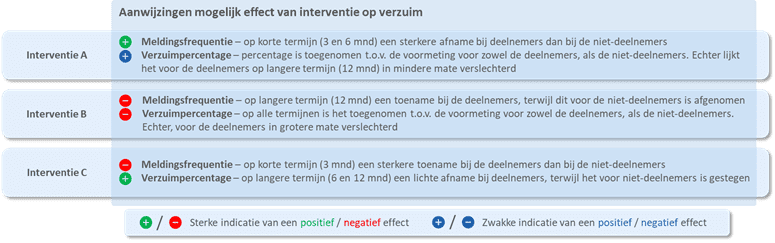
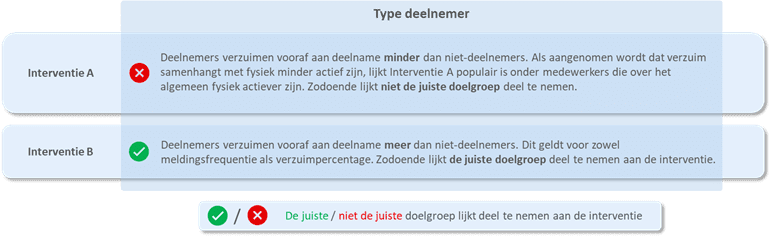
Many organisations have considerable budgets for preventative and curative absenteeism interventions. However, whether the right target groups are being reached with these interventions and/or whether the use of interventions actually reduces absenteeism remains unclear. An intervention-effect measurement resolves these matters and helps organisations to realise ROI on their absenteeism interventions.
How does an absenteeism analysis differ from standard absenteeism reports?
As mentioned earlier, an absenteeism analysis is different from the conventional approach to absenteeism. Below are the three main differences between a data-driven absenteeism approach using absenteeism analysis and the average absenteeism report:
- Big Data
Various data sources are combined in an absenteeism analysis. These include absenteeism data from the absenteeism system, but also data from the personnel administration and, for example, employee surveys. In addition, historical data is incorporated alongside the current state of affairs. All this data is brought together into an initial dataset, from which new variables are created. This results in a dataset that may contain hundreds of variables. - Machine learning
Once the data is collected, machine-learning techniques are used to extract patterns from the dataset. Where conventional HR reports manage to combine 2 or 3 variables in a cross table, machine learning looks at all of the variables simultaneously, yielding more profound insights. - Precision strike
While a conventional approach to absenteeism is often like shooting with hail, an absenteeism analysis is more like a precision strike. A data-driven approach points absenteeism managers to the root causes, enables them to formulate targeted policy/action plans, helps case managers and company doctors to plan their schedules, provides managers with a realistic absenteeism standard to aim for and proves the effectiveness of absenteeism interventions (or the lack thereof).
What sort of (absenteeism) data is used in an absenteeism analysis?
As stated above, an absenteeism analysis ideally combines several data sources. The most common internal sources are the absenteeism system, the personnel administration system and the employee survey system. These internal sources can be complemented with external sources.
By combining relevant internal and external sources and creating dependent variables based on the input from these sources, a dataset for an absenteeism analysis can consist of a hundred – or even hundreds of – variables.
Below is a non-exhaustive sample of variables, derived from employee surveys and the personnel administration system, which were used at a clients for an explanatory and predictive absenteeism analysis.

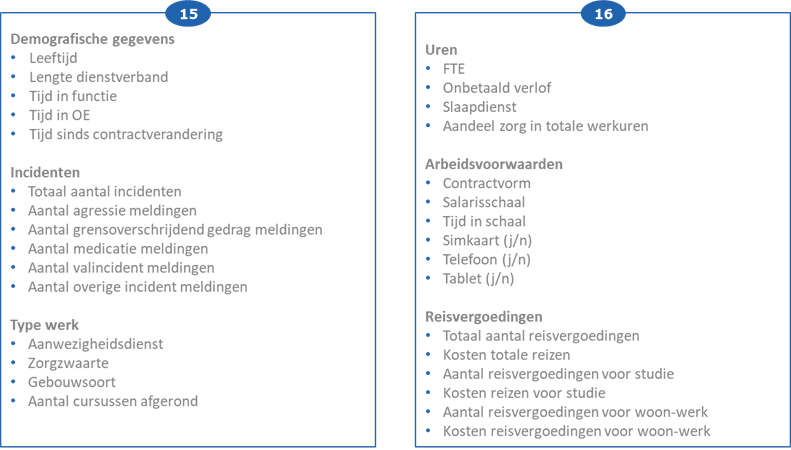
Are some of these sources unavailable? No problem! Smaller data sets can also yield useful absenteeism insights, and AnalitiQs can even help you to unlock the missing data or collect it through employee surveys.
Looking to get started with absenteeism analysis?Absenteeism report
In light of the above, it should not come as a surprise that AnalitiQs is a strong advocate of using absenteeism analyses to reduce absenteeism. At the same time, it is also desirable to have good old absenteeism reports. An 4-quadrant absenteeism graph, for example, is a nice tool to determine the type of absenteeism on which an absenteeism analysis should focus. Below you can find some help and inspiration to address some of the basics regarding absenteeism reports.
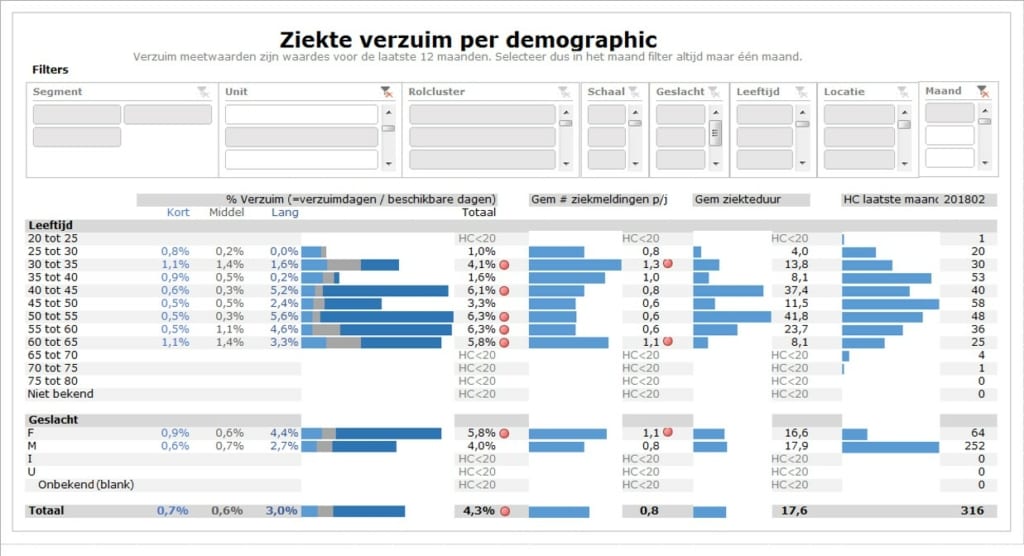
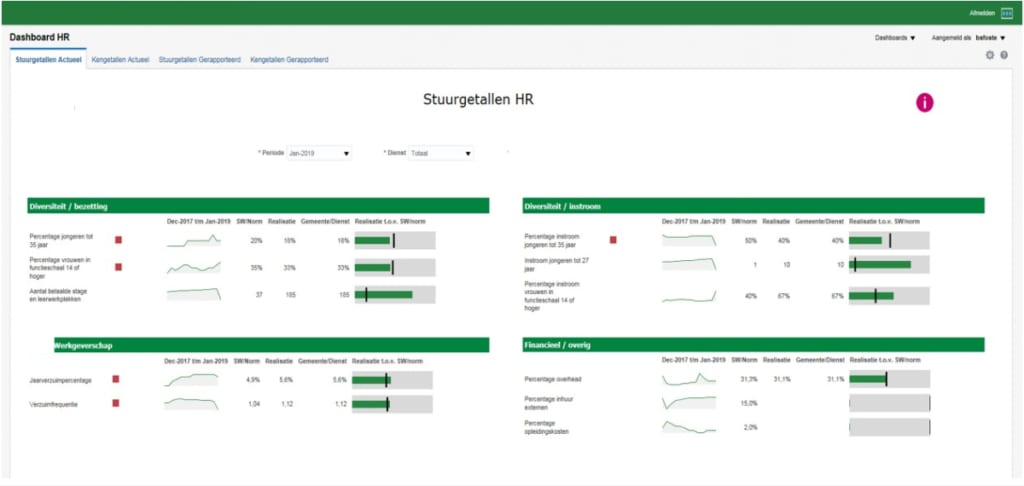
What makes a good absenteeism report / absenteeism dashboard?
AnalitiQs has built absenteeism dashboards in good old Excel, but also in visualisation software such as Tableau, MicroStrategy and PowerBI.
A good absenteeism dashboard contains the proper key indicators, is intuitive and allows users to easily filter and compare data.
What is absenteeism and how does it relate to an absenteeism analysis?
Employees who are absent can’t perform the work that they are supposed to be performing. This definition of absenteeism is too generic, however, to be useful for an absenteeism analysis.
An absenteeism analysis zooms in on absenteeism to identify the main opportunities to reduce absenteeism. As such, it distinguishes between different types of absenteeism while taking into account the background, the duration and the frequency of the absenteeism.
As to background, a distinction can be made between medical and non-medical absenteeism. While medical absenteeism is hard to manipulate, non-medical absenteeism (e.g. work stress), which constitutes the majority of absenteeism in the Netherlands, can be influenced by employers. That is why this type of absenteeism is interesting for many absenteeism analyses, including, for example, analyses seeking to identify causes and at-risk groups.
As to duration, Statistics Netherlands (CBS) identifies several categories: short, medium, long and extra long. While most employers see battling long-term absenteeism as their main challenge, there are others who are more severely affected by frequent, short-term absenteeism. For an effective analysis of absenteeism, it is therefore essential to gain a proper insight into where exactly the absenteeism challenge arises, so as to focus the efforts.
Looking to scope the absenteeism challenge together?Looking to use an absenteeism analysis to effectively reduce absenteeism?
- Business Case
- Absenteeism analysis
- Absenteeism dashboard
AnalitiQs helps you to identify where exactly the absenteeism challenge arises, what it costs and how much you can save by addressing it.
Through an absenteeism analysis, AnalitiQs helps generate insights into the business case for absenteeism.
Finally, AnalitiQs creates the absenteeism reports / dashboards that measure the impact of the data-driven approach.
Whitepaper on the data-driven reduction of absenteeism (Dutch)
Are you curious about tackling organisational absenteeism in a data-driven way? Order our White Paper by filling out the form to your right! It will be sent to you immediately by e-mail.
In our white paper, we introduce you to the world of data-driven absenteeism reduction. The following five questions are addressed:
1. How does data-driven absenteeism reduction compare to conventional absenteeism reduction?
2. How does data-driven absenteeism reduction work?
3. What are the deliverables of data-driven absenteeism reduction?
4. What data and technologies are needed for data-driven absenteeism reduction?
5. How can our organisation best start with data-driven absenteeism reduction?
Whitepaper
Frequently asked questions about absenteeism analysis
Can absenteeism actually be analysed under the GDPR?
Yes, the GDPR still leaves room for this. While inquiries into the nature and causes of the illness are not allowed, you can collect data on duration and recovery rate.
Is it necessary to have data from employee surveys to carry out an absenteeism analysis?
No it’s not; the analysis can be performed using only system data. The at-risk groups are identified through system data only, and system data contains valuable information regarding the buttons that can be pushed. Having survey data available does yield additional insights, however, which makes this type of data more valuable.
Can we use data from previous employee surveys?
Yes, you can. In fact, this is exactly what you want to do; you want to link this data to absenteeism in the months after the (previous) survey, so as to establish whether or not employee experience leads to absenteeism. Note that it is advisable to indicate at the start of a survey that the respondents’ answers may be used for additional analyses.
Can we use data from other suppliers?
Yes, you can. AnalitiQs is a member of the MOA and is thus authorised to use research data from other suppliers. When drafting and signing the contracts with these suppliers, however, we recommend that you include a provision that the data may or will also be used for further analyses, which may require sending it to a third party (i.e. AnalitiQs).
How can you guarantee the privacy of our employees?
Data privacy and security are of the utmost importance to AnalitiQs. No names and contact details are ever disclosed. In addition, dates are converted to less identifiable variables; for example, dates of birth are replaced with age in years. Moreover, outcomes are always reported at group level.
Which absenteeism definitions do you use?
We adopt these definitions in consultation. Preferably, we use the ones that your organisation is already using, but we may have to deviate from this principle to increase the opportunities for analysis.
Curious to know more about the use of absenteeism data?
In the video below, Irma Doze explains how absenteeism data can be used to reduce absenteeism. She discusses the key indicators of absenteeism, the absenteeism analysis and effect measurement after absenteeism interventions.
Detailed Service Overview
HR Analysis
Equal Pay
Gender mobility
Absenteeism
Employee Segmentation
Employee Retention & Attrition
Engagement
Impact Measurement / ROI
Learning & Development
Management Development
Onboarding
Organisational Network
Performance
Process Mining
Productivity
Recruitment
Restructuring / Organizational-Development
Reward
Strategic Workforce Planning
Succession Management
Employee Surveys
Culture
Employee Satisfaction
Job Satisfaction
Inclusion
Onboarding
Employee Turnover
Diversity
Employee Community / Panel
Employee Engagement
Employee Commitment
Employee Journey
Employee Net Promotor Score (eNPS)
Employee Value Proposition (EVP)
Employee Enthusiasm
Labour Market
Labour Market Panel
Labour Market Positioning
Leadership
Manager Feedback
Personal Development
Pulse
Retention
Role Clarity
Sentiment
Strategic Alignment
Team Feedback
Total Reward Optimization
Voice of the Employee (VoE)
Work from home
Work Stress
Work Pressure
Capability Building
HR Analytics Strategy
HR Analytics Product Owner
HR Analytics Outsourcing
HR Academy
HR Dashboards
Absenteeism Dashboard
Integral HR Dashboard
Leadership Dashboard
Learning Dashboard
Recruitment Dashboard
Reward Dashboard
Talent Development Dashboard
